- Scope Expansion: Traditional methods of static analysis typically analyze a single project at a time. Endor Labs, however, expands its scope to include not only the client projects but also their dependencies, often comprising over 100 packages.
- Enhanced Dependency Analysis: Endor Labs employs static call graphs to conduct detailed dependency analysis, enabling a comprehensive understanding of how different external components interact within client projects. By leveraging these call graphs, Endor Labs aims to minimize false positives and more accurately identify the specific locations of problems in dependencies.
- Multiple Data Sources: Endor Labs uses both source code and binary artifacts to enrich the analysis. This approach ensures swift results without a heavy reliance on test coverage.
- Benchmarking for Continuous Improvement: Endor Labs maintains accuracy and relevance by using dynamic call graphs internally to benchmark and refine static call graphs, thereby actively identifying and addressing gaps.
- Scalability: Endor Labs addresses the challenge of scalability and generates call graphs not only for each project release but also for all its dependencies. This approach effectively manages large projects with multiple versions, ensuring that the analysis remains both relevant and applicable across the entire spectrum of client dependency sets.
Java, Python, Rust, JavaScript, Golang, .NET (C#), Kotlin, and Scala.
View call paths
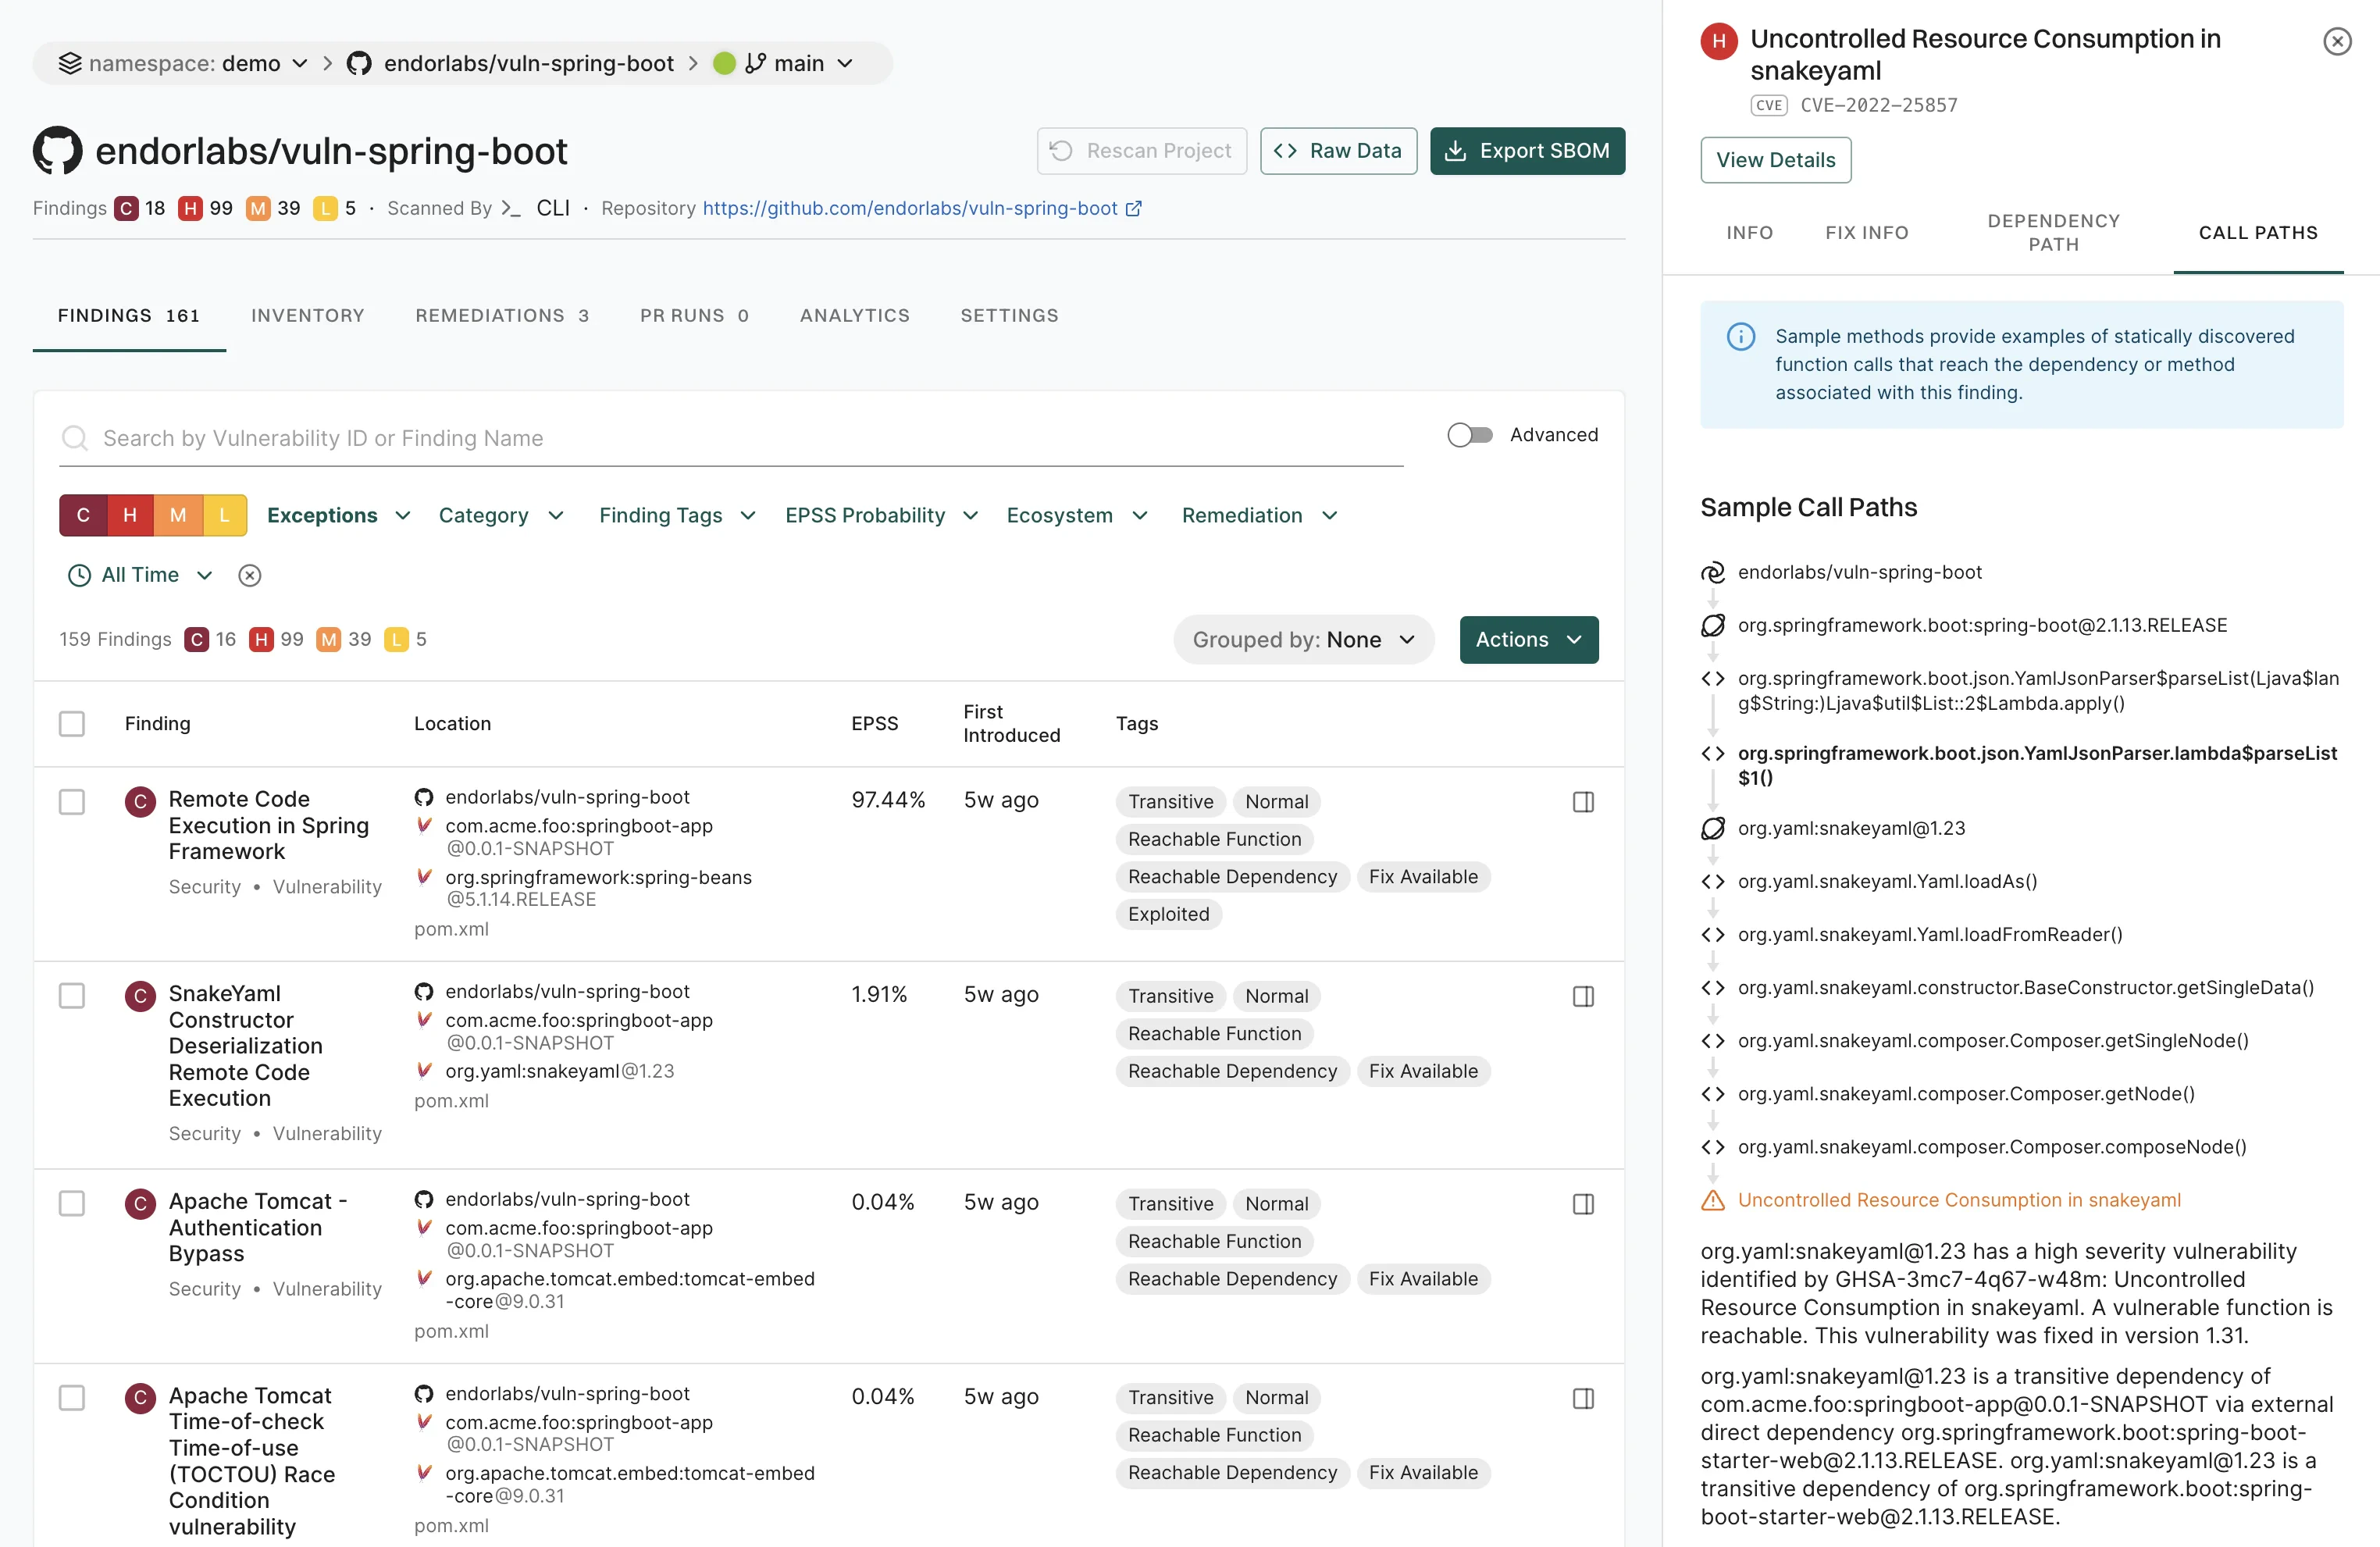
View call paths in Endor Labs to see the sequences of functions that your program invokes during execution.- Select Projects from the left sidebar.
- Select the project for which you want to view the call path.
- Select FINDINGS and select the finding from the list view.
-
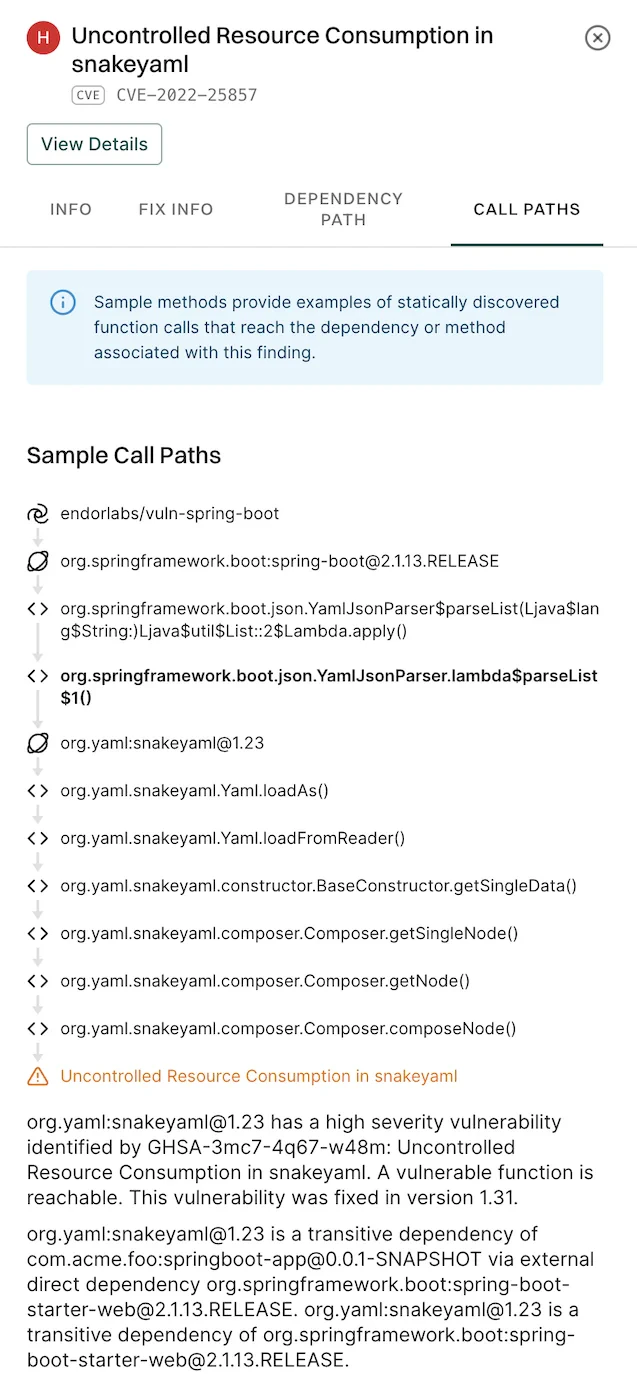
Expand a specific finding to view more details.
-
In the details section, select CALL PATHS.